
Maximizing NRR for B2B Saas with Predictive Insights
Transform customer engagement and retention through an automated AI powered prediction engine.
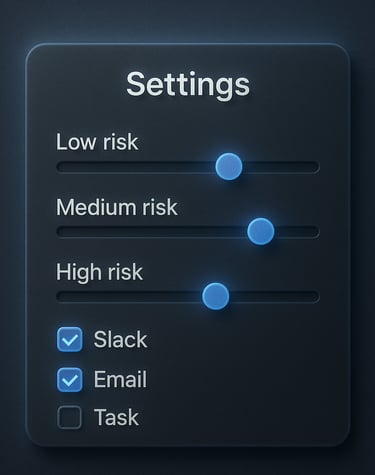
The right message to the right customer at the right time
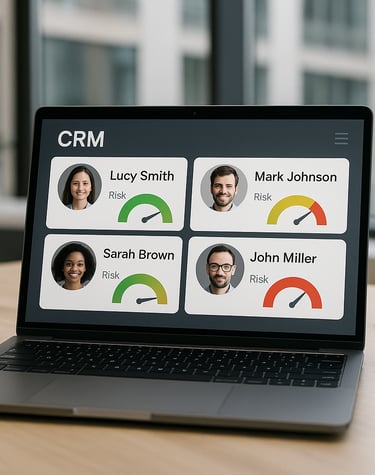
Customer Insights
Understand behavior patterns to enhance engagement strategies.
Optimize actions based on predictive analytics insights.
Drive Growth
Actionable Strategies
Data-Driven Decisions
Empowering Revenue Growth Through Insights
At Revenue Dragon, we specialize in B2B SaaS solutions that enhance revenue by predicting customer behavior and providing actionable insights for optimal engagement at every touchpoint.
150+
15
Trusted by Leaders
Proven Success
Revenue Growth Solutions
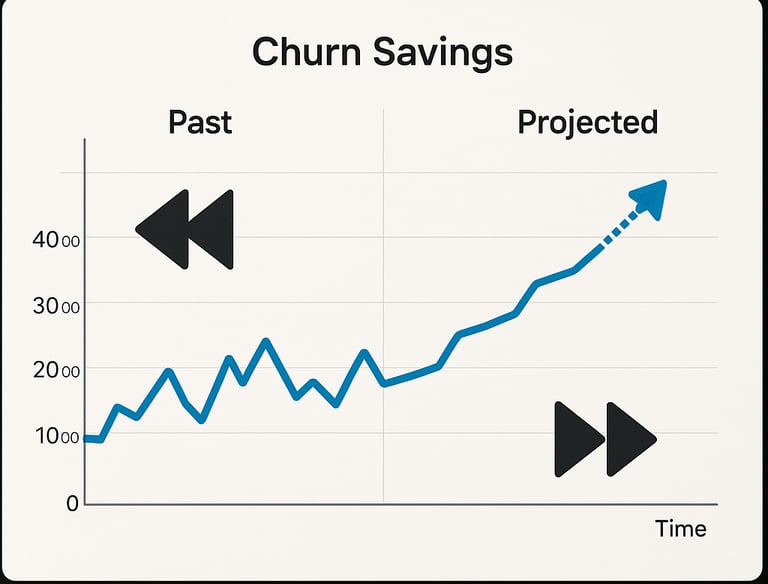
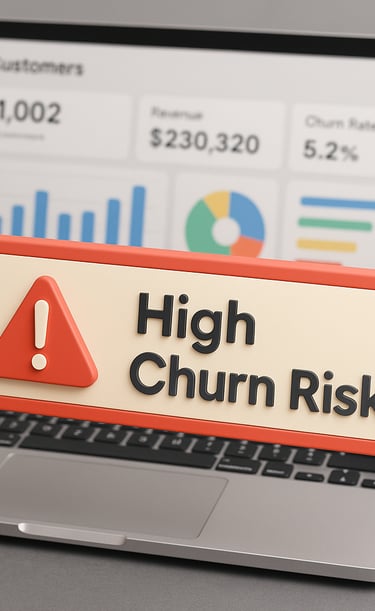
Unlock insights to enhance customer engagement and drive revenue growth with our predictive tools.
Predictive Analytics Tool

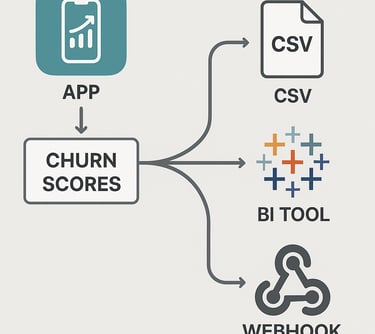
Leverage data to anticipate customer behavior and optimize engagement strategies effectively.


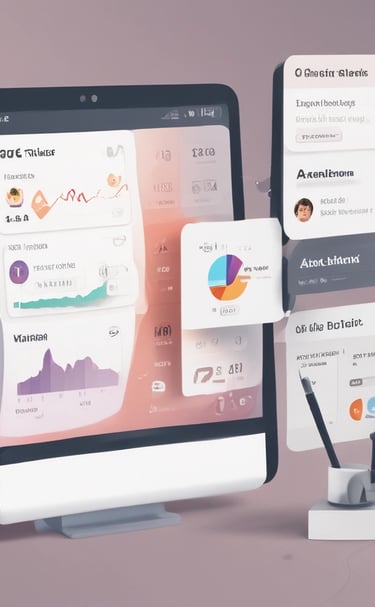
Customer Insights Engine
Gain actionable insights to tailor your approach and maximize customer satisfaction and retention.
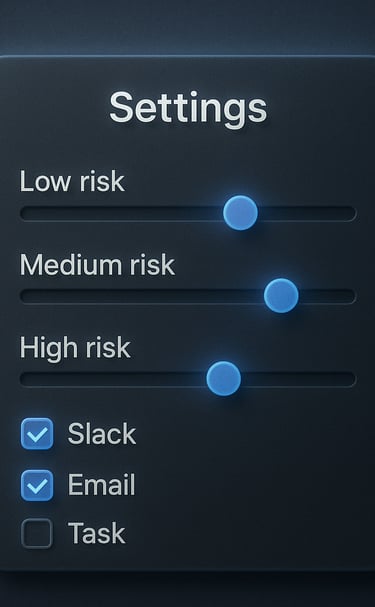
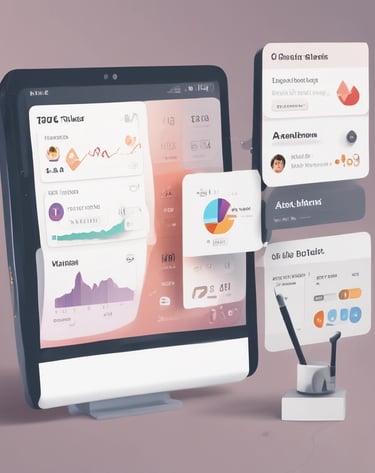
Transform your engagement strategies with data-driven insights for better customer interactions.
Engagement Strategy Optimization
Revenue Dragon has transformed our approach to customer engagement, providing invaluable insights that have significantly boosted our revenue. Highly recommend this powerful tool!
James Marshall, CMO

★★★★★
Customer Insights
Predict behavior, enhance engagement, and drive revenue growth effectively.


Insights
Unlock customer behavior to drive your revenue.
Support
Connect
sales@revenuedragon.ai
© 2025. All rights reserved.
Terms of Use